Anne

Coming to Statistica  
in 2022/2023

Zoom tutorials
using Explaineverything app
We a record sessions for you to listen to later

CALL STATISTICA NOW


Please contact Statistica
with questions or comments.
 © Copyright 2022  Statistica
 All rights reserved
.

E-mail     anne@statistica.com.au

Phone           (08) 9457 2994

Place         Willetton, Western Australia

Twitter        @Anne_statistica

BuiltWithNOF
SPSS Two Sample
 Hypothesis tests

Mathematics & Statistic Tutor Perth - SPSS Help   

Tests of Normality


Kolmogorov-Smirnova

Shapiro-Wilk

Statistic

df

Sig.

Statistic

df

Sig.

difference

.172

8

.200*

.956

8

.769

*. This is a lower bound of the true significance.

a. Lilliefors Significance Correction

Video Explanation Link

Descriptives


Statistic

Std. Error

difference

Mean

1112.5000

514.23921

95% Confidence Interval for Mean

Lower Bound

-103.4825


Upper Bound

2328.4825


5% Trimmed Mean

1086.1111


Median

1150.0000


Variance

2115535.714


Std. Deviation

1454.48813


Minimum

-900.00


Maximum

3600.00


Range

4500.00


Interquartile Range

2325.00


Skewness

.241

.752

Kurtosis

.102

1.481

Video Explanation Link

Paired Samples Test


Paired Differences

t

df

Sig. (2-tailed)

Mean

Std. Deviation

Std. Error Mean

95% Confidence Interval of the Difference

Lower

Upper

Pair 1

Y - X

1112.50000

1454.48813

514.23921

-103.48251

2328.48251

2.163

7

.067

Paired Samples Test


Paired Differences

t

df

Sig. (2-tailed)

Mean

Std. Deviation

Std. Error Mean

95% Confidence Interval of the Difference

Lower

Upper

Pair 1

Y - X

1112.50000

1454.48813

514.23921

-103.48251

2328.48251

2.163

7

.067

Video Explanation Link

Tests of Normalitya


Kolmogorov-Smirnovb

Shapiro-Wilk

Statistic

df

Sig.

Statistic

df

Sig.

RunTime

.118

5

.200*

.999

5

.999

*. This is a lower bound of the true significance.

a. Company = A

Tests of Normalitya


Kolmogorov-Smirnovb

Shapiro-Wilk

Statistic

df

Sig.

Statistic

df

Sig.

RunTime

.236

7

.200*

.839

7

.098

*. This is a lower bound of the true significance.

a. Company = B

Video Explanation Link

Descriptives


Company

Statistic

Std. Error

RunTime

A

Mean

98.4000

3.90640

95% Confidence Interval for Mean

Lower Bound

87.5541


Upper Bound

109.2459


5% Trimmed Mean

98.3889


Median

98.0000


Variance

76.300


Std. Deviation

8.73499


Minimum

87.00


Maximum

110.00


Range

23.00


Interquartile Range

16.00


Skewness

.057

.913

Kurtosis

-.309

2.000

B

Mean

110.7143

12.16497

95% Confidence Interval for Mean

Lower Bound

80.9477


Upper Bound

140.4809


5% Trimmed Mean

108.7381


Median

97.0000


Variance

1035.905


Std. Deviation

32.18547


Minimum

82.00


Maximum

175.00


Range

93.00


Interquartile Range

35.00


Skewness

1.563

.794

Kurtosis

2.518

1.587

Independent Samples Test


Levene's Test for Equality of Variances

t-test for Equality of Means

F

Sig.

t

df

Sig. (2-tailed)

Mean Difference

Std. Error Difference

95% Confidence Interval of the Difference

Lower

Upper

RunTime

Equal variances assumed

3.887

.077

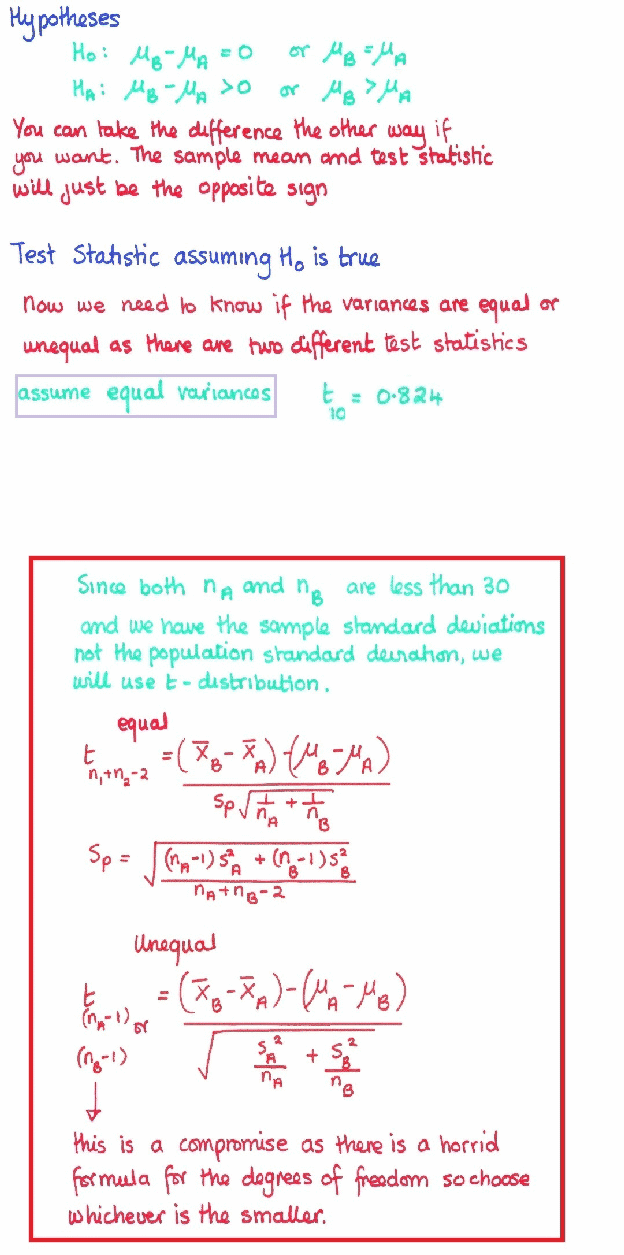
.824

10

.429

12.31429

14.95207

-21.00100

45.62957

Equal variances not assumed


.964

7.187

.366

12.31429

12.77679

-17.73974

42.36831

Video Explanation Link

Independent Samples Test


Levene's Test for Equality of Variances

t-test for Equality of Means

F

Sig.

t

df

Sig. (2-tailed)

Mean Difference

Std. Error Difference

95% Confidence Interval of the Difference

Lower

Upper

RunTime

Equal variances assumed

3.887

.077

.824

10

.429

12.31429

14.95207

-21.00100

45.62957

Equal variances not assumed


.964

7.187

.366

12.31429

12.77679

-17.73974

42.36831

Video Explanation Link

[Home] [Parents] [Contact us] [Services] [Mathematics] [Statistics] [School]
Google+